Keith Wendte asks himself the same question every time he makes an adjustment on his family’s Effingham County, Ill., farm: Is this providing a return on investment?
If it isn’t, then forget it, he’ll try something new. And when it comes to precision tools, there aren’t many he hasn’t tried.
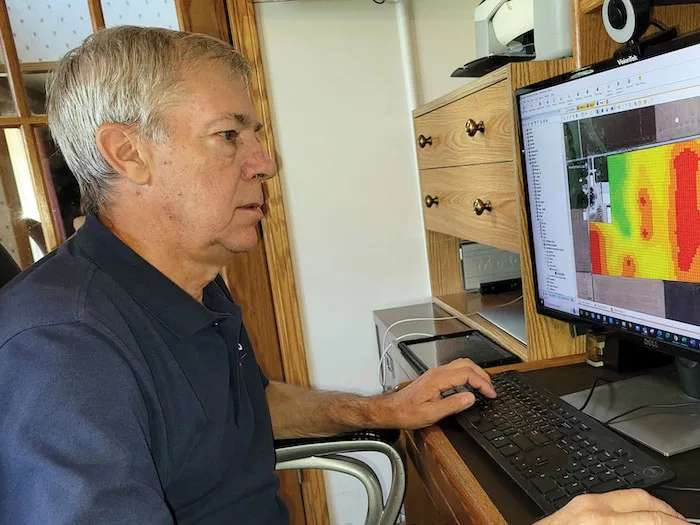
Wendte manages data and analysis for his family’s 7,000-acre operation from an office more than 200 miles away in the Chicago area. The family grows corn, soybeans and wheat.
“My responsibilities include the collection, organization and analysis of data on our farm and the creation of application maps,” says Wendte, who recently wrapped up a 37-year career as an engineer first for International Harvester and later Case IH and CNH Industrial.
9 Different File Types
Wendte was an early adopter of precision farming technology nearly 30 years ago. He first used yield maps in 1994, GPS and grid soil sampling in 1997, variable rate technology (VRT) fertilizer application in 2005, RTK auto-guidance in 2012, high speed planters with individual shutoff row units in 2020 and now he’s looking at implementing drone technology on the farm in 2023.
“We would use a drone to apply fungicide and insecticide,” Wendte says. “This is important for our wheat crop because when we’re applying fungicide early in the spring, it’s wet and many times we don’t have the ability to get in there with a sprayer. The drone would also give us the ability to put in our own check plots, so we can evaluate how well the fungicide is performing. We might also look at using the drone to spread cover crop seed in standing cash crops.”
Wendte always thinks about how to get the most bang for his buck when considering new products to invest in.
The farm currently uses products from Case IH, Ag Leader, AGCO, Trimble, Precision Planting and Kuhn, and he finds himself managing up to 9 different file types of data at the end of the day.
“I would like to narrow it down to 2-3 file types eventually to make things a whole lot easier,” Wendte says. “There are so many different formats that it’s hard to keep track of what file type each machine uses. After I’ve evaluated data and made prescription maps, I have to export it to the machine to do variable rates. Having a different format for every machine becomes cumbersome.”
Juggling so many different types of data has proven challenging, even to someone with an extensive background in engineering. Wendte believes farmers who are interested in data analysis could benefit from working with a data management professional.
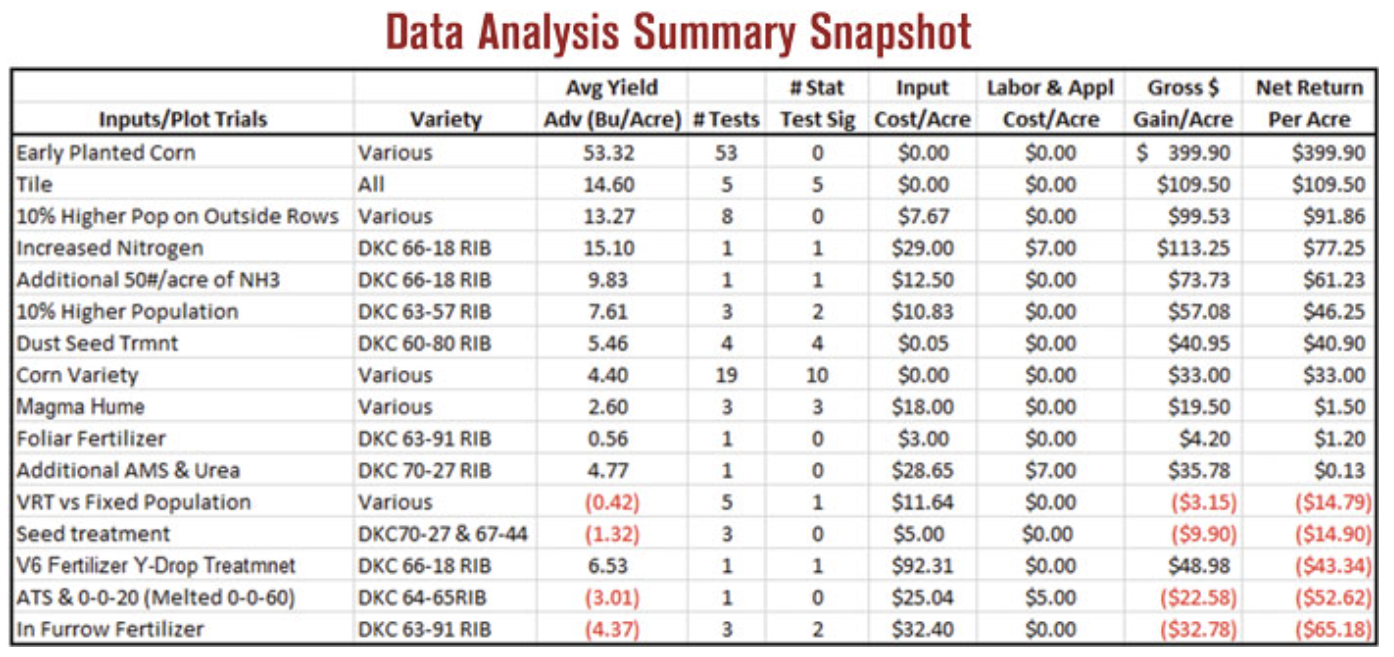
PLOT DESIGN 101. Keith Wendte organizes all his test plot data into a single table at the end of the year. If a certain test proves statistically significant 2-3 years in a row, there’s a good chance he’ll adopt the practice permanently. Wendte recommends choosing a field that is relatively uniform when conducting test plots.
“Farmers are sometimes unwilling to share their data, so they might be afraid to hand it over,” Wendte says. “However, if they don’t have the background or time to do it, that would be a good way of analyzing and using data to make changes on their farm to make them more efficient in the future.”
Wendte uses Microsoft OneDrive to store all his data. This makes it easier to share data and results with other family members, plus it provides a method for secure data backup in case of a hard drive failure. He strongly recommends analyzing data using a Solid State Drive (SSD) instead of a mechanical Hard Disk Drive (HDD) that’s built into a computer.
“Solid drives are safer and less likely to mechanically break,” Wendte says. “It’s also 6 times faster than a mechanical drive. Get the solid drive if you’re doing sophisticated data analysis. It’s worth the extra money.”
He uploads all his harvest and planting data to cloud storage offered by Farmers Business Network (FBN) at the end of the season.
“I use FBN mainly to compare ourselves to other farmers in our neighborhood, so we know how we’re doing,” Wendte says. “It’s a metric we use to see if what we’re doing is right.”
Using Maps for Water Management
Wendte subscribes to several digital platforms, including AFS Connect Farm and Climate FieldView, which allow him to monitor harvest, spraying and planting operations in real time.
He also relies on his RTK signal and DigiFarm to gather elevation maps critical to managing excess water.
“There’s a claypan layer on our soils, so tiling is not always effective,” Wendte says. “We rely on surface drainage to get rid of excess water on our fields. When we plant corn and soybeans, elevation data tells us where to place our surface ditches.
“Our yields are determined by how we handle excess water during growing season…”
“Some of our fields are over 30 miles away, and RTK doesn’t work more than 8 miles away. DigiFarm uses cellular modems and satellites to get the correction signal, which enables us to get accurate elevation maps on fields located a long distance from the farm without having to set up a remote correction signal.”
Wendte won’t hesitate to take action during growing season if his FieldView maps show excess rainfall.
“If the crop is very young, we can go in there and make a surface ditch and then come back a couple weeks later to find out if we improved it based on the map,” Wendte says. “Our yields are determined mainly by how we handle excess water during growing season.
“During harvest, we use the tag function to highlight some problem areas, such as wet spots. Not only can you identify these areas through yield maps, but you can also do it by the combine tracks in the field — they’re a lot deeper. We tag them, and make sure that we get surface ditches placed over those spots for next year’s crop.”
Measuring Soil Health
Soil testing is a critical piece to the puzzle for Wendte. Soil tests are taken after soybean harvest. Tests are completed on 2.5-acre grids with a Veris Technologies machine once every 2 years on fields where chicken litter is spread, 3 years on soybean-wheat-corn fields and 4 years on corn-soybean fields. After the data is collected, he uses spreadsheets to analyze the data and create fertilizer application maps.
“Spreadsheets give me more control,” Wendte says. “I can adjust the formulas easier, plus I have all my data in one place and it’s easier to analyze. Once I create the spreadsheet and use the formulas to calculate how much fertilizer we need to apply, I put it in a text file, import it into the Ag Leader SMS database, and it creates the prescription map for the fertilizer spreader.”
Wendte follows the University of Illinois’ goals to determine fertilizer requirements for phosphorous (P), potassium (K) and micronutrients. He calculates his application rates by subtracting the sample result from the goal, adding the amount of fertilizer needed to reach the goal plus next year’s crop requirement based off corn and soybean yield goals. Nothing is applied when the soil test is high enough to meet next year’s crop requirement.
Wendte hopes to see a more uniform method for soil testing on the market soon.
“I would also like to see more work done on developing on-the-go soil testing, so we wouldn’t have to gather samples and send them to the lab,” he says. “I’d like to see the same with tissue sampling as well.”
Although Wendte has been ahead of the curve, other farmers in his region have been slower to embrace certain precision technologies like VRT. But there has been an uptick in the overall adoption rate of other precision tools such as row shutoff and auto-guidance, he’s noticed.
“Auto-guidance is a no brainer,” Wendte says. “That’s really come on strong. Just about everyone I know in our area utilizes it. It’s really made farming a lot easier.”
![[Technology Corner] Farmers Gain Trust in Autonomy with PTx OutRun Retrofit Kit](https://www.precisionfarmingdealer.com/ext/resources/2026/07/09/Farmers-Gain-Trust-in-Autonomy-with-PTx-OutRun-Retrofit-Kit.webp?height=290&t=1783695127&width=400)

