
We continually refine our farming system. While my brother, Bill, and I know we’ll never get to specific end goals with many practices like efficient fertilizer use, we’re always chasing and narrowing the gap.
Our chase is very deliberate. Data from field trials, rigorous soil sampling, imagery and more guide decisions we spend years making. We operate on the premise of think, believe and then know.
A big part of ‘think, believe, know’ is data collection. Data especially drives our variable-rate efforts. From seed to commercial inputs, we want to find the sweet spot where we maximize return on investment for each acre.
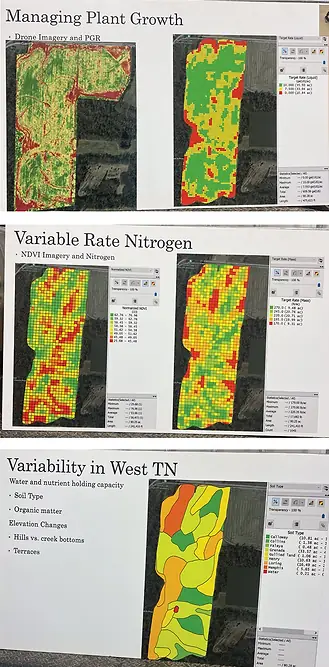
Our first foray into variable-rate application was using plant growth regulators (PGR) on our cotton. We knew the production responded well to the practice, but PGRs were very expensive at the time. Not all acres needed the same rate. A higher rate of a PGR is beneficial in areas like bottoms where the crop is growing vigorously, but a lower rate would suffice for the rest of the field.
Initially we used simple strategies such as adjusting our speed to impact rate. When we saw the benefits of our unrefined efforts with PGRs, we reached out to Tim Sharp for help tightening up the system and exploring other precision strategies. At the time he was a professor at Jackson State Community College working to develop precision strategies and technologies for many agricultural applications.
We used several methods of data collection. We tried soil electrical conductivity (EC) testing, but found our soil EC doesn’t change enough for that data to be meaningful on our operation at the time. To get the granularity we wanted, we opted to soil sample on 2.5-acre grids, used yield maps and tried one of the earliest Greenseeker sensor applications.
We used an ATV-mounted Greenseeker unit to record 60-foot swaths of sensor data on crop vigor when cotton was at the 7th to 9th node. The data was put into a computer model to generate an application map. We could use this information to guide PGR applications in cotton and nitrogen (N) applications in cotton and other crops. We used a homemade variable-rate applicator to apply N. It was a combination of a controller and a butterfly valve to increase or decrease flow on our coulter rig. It worked very well.
At the time we were also using soil test and yield data to variable rate phosphorus (P) and potassium (K) with our spinner truck. The technology we had wasn’t working precisely enough to achieve our goals. We were told a new $10,000 controller was the answer.
Keeping with the ‘think, believe, know’ method, we worked out a deal where we tried the technology before we committed to buying. It ended up working like a charm and we’ve adopted more and more variable rate technology across the board in the years since.
Variable Results
Today we have several ways of getting very precise data on our fields and have application tools that can put that data to work in the field. When it comes to our fertility program, variable rate has proven to be a long-term winner.
The Cotton Trust Protocol collected 10 years of data on our farm comparing a straight-rate conventional fertility program to our variable rate program. This was in the same fields on the same farms. The variable-rate system was determined to have reduced our fertilizer usage by 40%. During the same 10 years, yields continued to go up. That means we’re doing something right and motivates us to continue to refine the system.
We’re constantly adjusting, exploring, refining, and calculating how we can push the economic benefit. It’s farming by the foot, and that requires quality, current information.
Every field is grid sampled every year. This may seem extreme, but there’s good reason. For one, we’re never entirely sure what crop will go in what field until planting day.
When I pull the soil samples I may be planning to plant 3,000 acres of cotton. If we miss our planting window, suddenly we’re planting 3,000 acres of soybeans instead. We fertilize the land according to its needs every year, not the estimated needs of the crop we’re planning to grow.
I can’t afford to mine the soil one year if I end up adapting cropping plans and then expect it to produce top yields the next year. That’s not how our soils work. We have to be more consistent with our fertility strategy.
Another driver for yearly soil sampling is our soils seem to change quickly. On average we farm just 5 inches of topsoil above a well-established hardpan that no amount of diesel and iron can remedy. Since crops grow in such a small pot, the concentration of nutrients changes dramatically from season to season with crop use. We’d like to soil test less, but for now it seems necessary.
The soil test is a complete workup of NPK and micronutrients. All P and K is variable-rate applied with spinner trucks. For corn and cotton, we use our sprayer to make a blanket application of liquid N and any secondary nutrients within 12 hours of planting.
The N in this application also serves as the carrier for our pre-emerge and secondary burndown herbicides. We burn down our cover crops early in the season. Once we’re planting, some small weeds are starting to pop up. Using N with the herbicides helps us get a very effective burndown and prevent breakthroughs. We’re in the heart of weed resistance territory and we have them all—marestail, pigweed, grass—so we really must stay on top of weeds.
Aerial Assist
Aerial imagery and yield monitor data are used in part to determine rates for sidedressing N, applying PGRs, or adjusting seeding rates. We use Normalized Difference Vegetation Index (NDVI) captured by satellite, airplane, or drone.
Late-season cotton imaging shows us where plants are dense and healthy. Those areas are where we need to apply higher rates of PGRs. Those areas are also where we’re more likely to find late-season insect pressure. We can use the data to guide scouting and often make spot treatments instead of applying pesticide to the entire field.
We’ve found late-season cotton provides some of the best NDVI images and data for long-term use. These are used to show the truth of how the soils throughout our fields react, or how we might expect them to react, to various inputs.
When we have a new farm, we’ll try to plant it to cotton soon so we can get the high-quality data set. The data can be used in subsequent years to manage any crop. The goal with imaging is to see where our soils are at and identify where we can make them more productive, or more efficiently productive, with inputs in the future.
There is now excellent software available that allows us to compile all this data. We can overlap soil test results, yield, NDVI, and application data from multiple years and extrapolate all sorts of useful data.
When we first started, we would change rates two to three times in a field. Now we have the information and technology to change rates two to three times per second. Sometimes we’re on the cutting edge of technology, and occasionally we’re on the bleeding edge, but that’s OK. Not everything will work but you have to be willing to try a little. Our thinking is if you’re not leading then you’re probably getting left behind.
Data To Action
The data we gather from yield monitors and imagery is great, but it’s only part of what’s needed to be successful. Seeding, for example, is all variable rate but still the rates are set based on what we’ve learned about our soils through trials.
Years of on-farm trials have helped us dial in our sweet spot for planting populations. For corn we tested rates from 18,000- 40,000 seeds per acre for multiple years. Our sweet spot for economic production is 24,000-32,000 seeds per acre. In very good, irrigated soil we might hit 34,000 occasionally, but we’re seldom over 30,000. We’ve found in most cases when we push past 30,000 we start to see diminishing return.
The data doesn’t lie. Sometimes it might make you scratch your head, but it doesn’t lie. Data taught us that in poorer soils it pays to increase cotton populations. With corn, we decrease the seeding rate in poorer soils. We also test varieties. We look at how they do on irrigated acres vs dryland and how they work in different soils or react to inputs.
Enriched test strips help us determine if we should explore increasing nutrients. We will do a 100-foot strip of corn or cotton with a maximum rate of N, P, K or even magnesium. We have those scattered around the farm every year. They tell us what we’re applying enough or pinpoint areas we might push for an increase in yield or economics. Again, this goes back to think, believe, and know. We’re constantly exploring and evaluating.