With growing competition in the U.S. agricultural community from all over the world, today’s growers have reached a point where simply using their instincts is no longer a viable option. Increased regulations and restrictions for water resources have brought about the need for fast, easy and efficient tracking of both water and environmental conditions within each field.
By utilizing technology to monitor micro-climate and soil moisture on site, growers now have easy and effective solutions to improve irrigation competency. Efficient use of water in irrigation can not only improve yields, but also save water and energy, improve crop quality and reduce nutrient leaching.
The ability to measure, monitor and manage root zone soil moisture with highly reliable technology that is easy to use, is crucial to maximize yield and quality. Numerous studies in the Midwest clearly demonstrate that moisture management using soil moisture probes can increase yield and, in some cases, lower input costs for a corn and soybean crop. Irrigation planning should be calculated based on crop water uptake, evapotranspiration, infiltration rate of the water to have good drainage and to avoid long time water saturation of the soil.
Metos USA weather station, iMETOS IMT300 or μMETOS ET0 (LPWAN variant) is a useful tool for evapotranspiration (ET0) calculation. These units can record measurements of air temperature, humidity, wind speed and solar radiation sensors. Reference evapotranspiration (ET0) is calculated on a daily basis and provides the amount of water lost by the plant and soil through transpiration and evaporation.
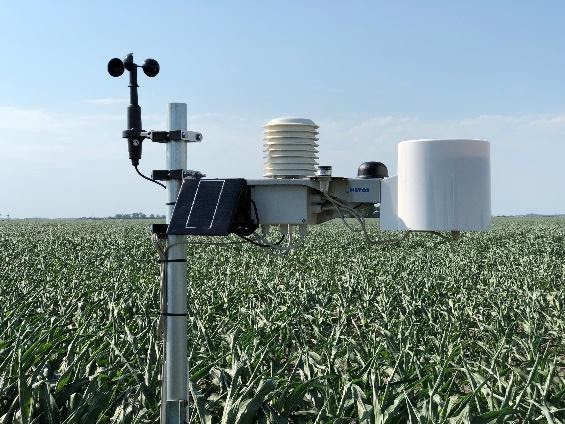
Figure SEQ Figure \* ARABIC 1. iMETOS IMT300 weather station.
Utilizing the Water Balance Method then allows us to calculate crop evapotranspiration ETC and is a common strategy used worldwide in irrigation scheduling. Growers will see a direct correlation between crop water needs and climate conditions. Site specific weather forecasting is also included with the Pessl Instruments software.
FarmView enables consultants and growers to view all the data at farm, field or identified crop zone level. The service consists of multiple modules dealing with water balance (IRRIMET), soil moisture, satellite data, disease modeling, equipment trackers and plant nutrition.
Users are asked to provide necessary information about crop type, FAO crop coefficient Kc and other personalized coefficients for different phenological stages like seeding, flowering and harvesting dates in order to define the ETC for the specific crop they are monitoring. The water balance is calculated in function of ETC, rain and rain efficiency, type and efficiency of irrigation system and irrigation events. In doing this, water stress or surplus within the field or management zone can then be clearly visible.
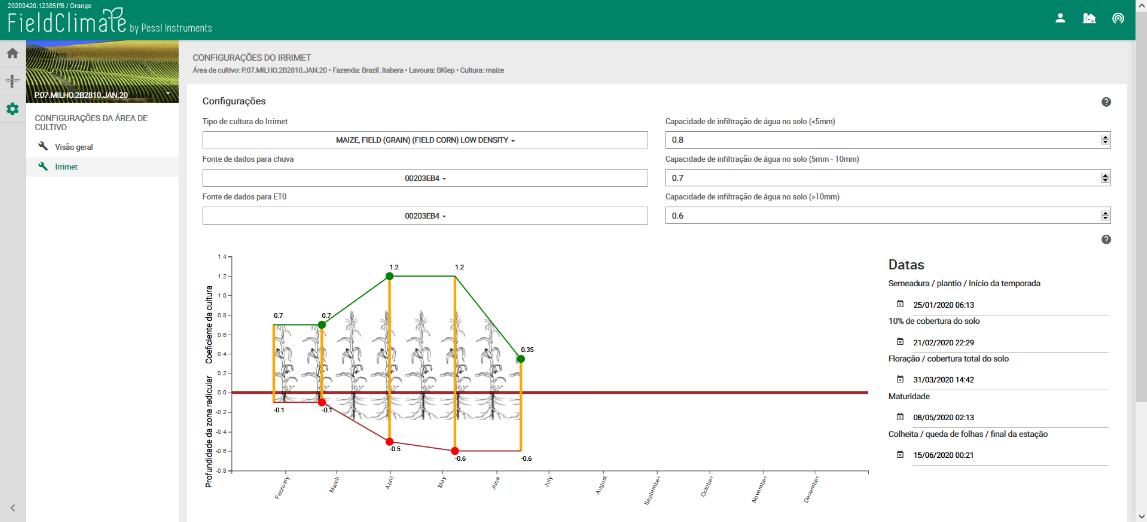
Figure 2. Farmview snapshot showing how to do multiple settings required for Irrimet with one interactive graphic.
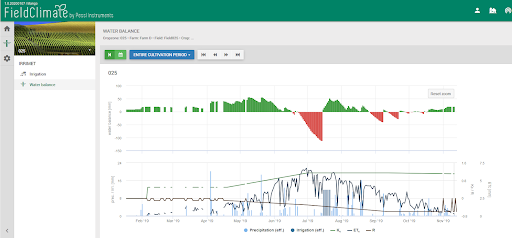
Figure 3. Farmview snapshot showing the daily water balance (water deficit versus water surplus) derived from your inputs: Precipitation, evapotranspiration, irrigation and canopy root zone.
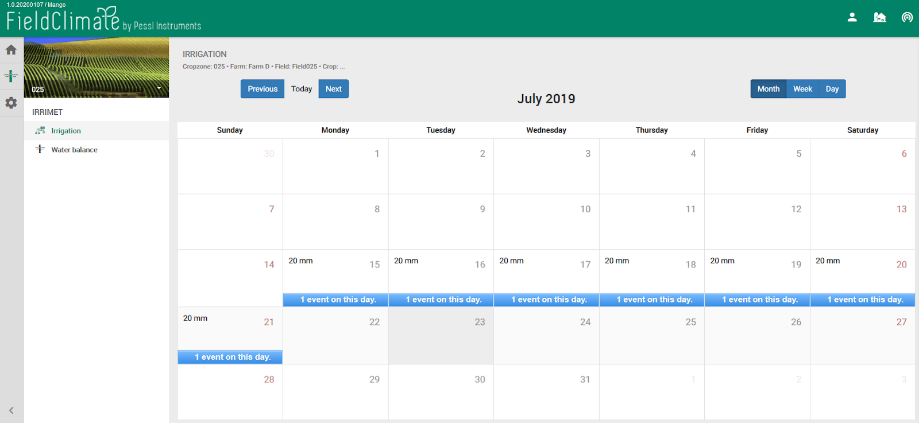
Figure 4. Farmview snapshot of the IRRIMET calendar enabling you to record and edit irrigation.
Combining field level micro-climate measurement with soil moisture sensors is essential for a proper irrigation scheduling and allows us to better assess and optimize the water management over the whole growing period. Our top IoT solution for this, is the iMETOS ECO D3 DDT. Pessl Instruments offers in its Portfolio, a wide range of OEM soil moisture probes and allows to design the best soil moisture monitoring solution based on the characteristics of your soil, crops, irrigation systems, arrangement of the terrain and field management.
In-ground probes provide our software with accurate measurements of soil moisture content, soil temperature and salinity at tiered layers through the soil profile.
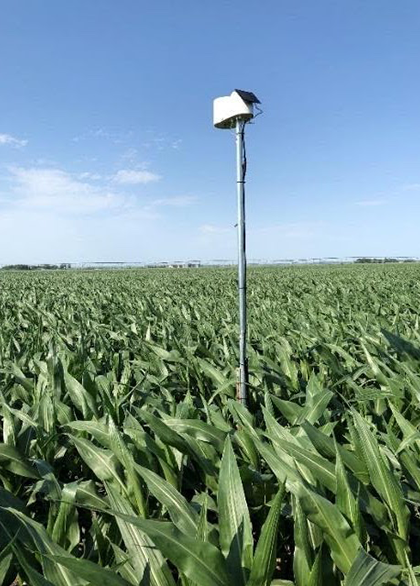
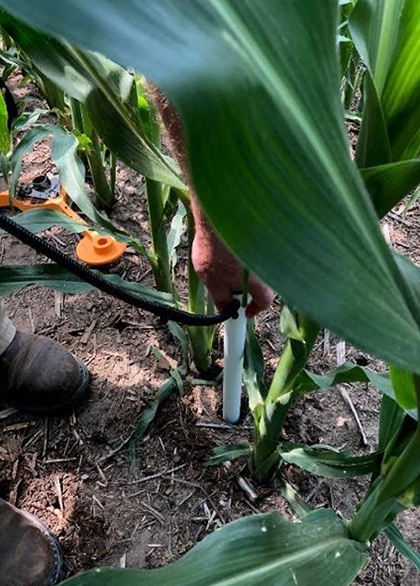
Figure 5. On the left, iMETOS ECO D3 and on the right, installation of a profile probe on a corn field.
All the data measured is transmitted to the platform Fieldclimate and can be accessible both on the convenient mobile app or on our desktop website. Figure 6 is an example of real-time root zone soil moisture levels at sensor depths at every four inches (stacked graph). Calculation of an average root zone soil moisture graph is defined by the user where the upper full amount known as full point or field capacity and the lower amount or refill point. Figure 7 is a continuous measurement of rain and daily ET0.
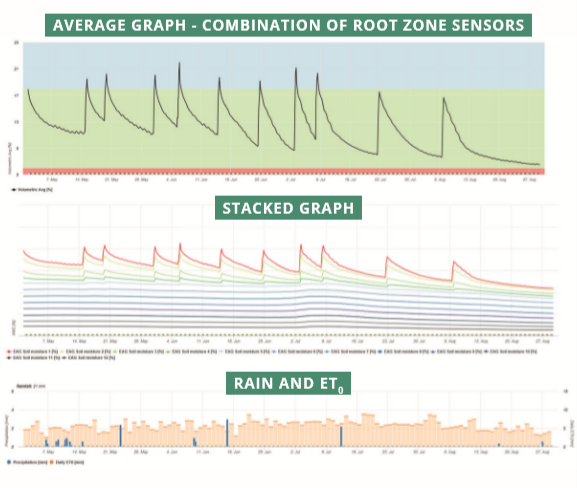
Figure 6. Soil moisture and climate data in different views from Fieldclimate platform.
Corn needs plenty of moisture and no stress to maximize yield potential. Proper timing of that irrigation is crucial. It is important to keep the right amount of moisture over the season, avoiding any water stress, and maintaining the desired moisture content within the active root zone. Previous studies have shown that minimizing root zone moisture stress can increase yields by 10-25%, potentially bringing the grower more than a 4-to-1 return on investment.
To get optimal results from irrigated crop production, the irrigator must be able to predict the onset of plant water stress points. They must be able to calculate the amount of water lost from the root zone, to determine the volume to be applied at the next irrigation.
Full and refill point budget lines are color coded so users can clearly see the range of soil moisture for optimal management – red (deficit), green (comfort zone) and blue (excessive soil moisture). Quality, accurate, reliable technology is critical to be able to gain these facts and to make good decisions about when and how much water to apply, to support plant health, without wasting resources.
Timing of irrigation events on soybeans is also very crucial to yield. In most of the cases, irrigation can happen very early and late into the growing season, and in particular irrigating later in the season can increase yield and improves plant health. Focusing on the tougher areas within each field, growers can have the peace of mind that if their most stress prone soils are being monitored adequately watered, the rest will be good as well.
The graph below shows the soil moisture at individual depths in the soil profile over a period of four weeks. Zooming in shows the stepping which is caused by plant water extraction during daylight. This means that roots are active at that depth and its absence that roots are inactive. In this way the amount of water being used by the plant at each depth can be known. In this example, stepping is present in the upper three sensors, but not in the lower three sensors.

Figure 7.
Therefore roots are only active in the upper three sensors, and this irrigation was made with the right amount of water. Fertigation has to be made also in the active root zone, it allows for increased nutrient absorption by the crop and reduces the chance of leeching chemicals into the water supply and improves yield.
The Pessl Instruments Fieldclimate platform has advanced tools for additional calculation for SUM, AVG (average) and plant available water (PAW) over the root area, which delivers one single normalized value per soil moisture probe with a color indication (dry: PAW < 0, ok: PAW 0-100, wet: PAW > 100).
The sensors within the root zone can be summed to get one value. Figure 10 represents the changes in summed water content for the upper three sensors over four days. After the rise, the amount of water falls during the day and the night with the rate of fall during the day greater than that at night: the fluctuation tells how much water the plant is taking up.
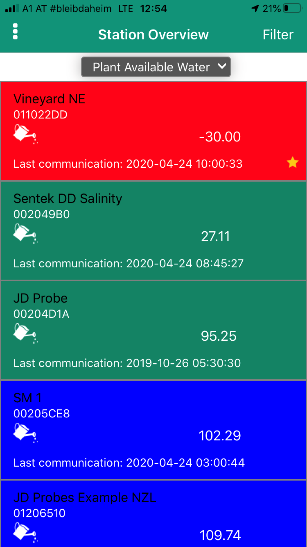
Figure 8.
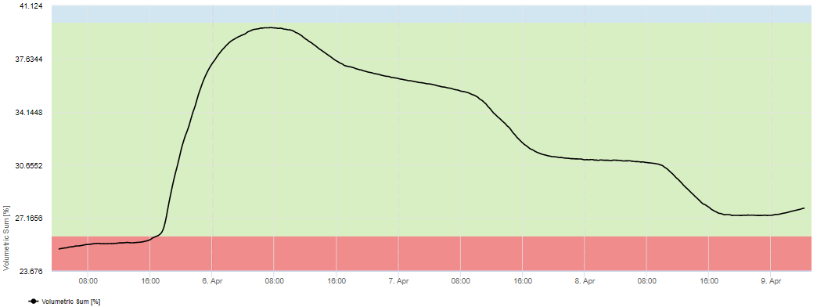
Figure 9.
When soil water is readily available the daily variation is driven by weather, and once there is no plant water extraction, crop begins to experience water stress.
By overirrigating, nutrients are washed down through the soil and a shallow root pattern can develop. That does not help the plant in times of heat or drought, compared with a plant with a deep root base.
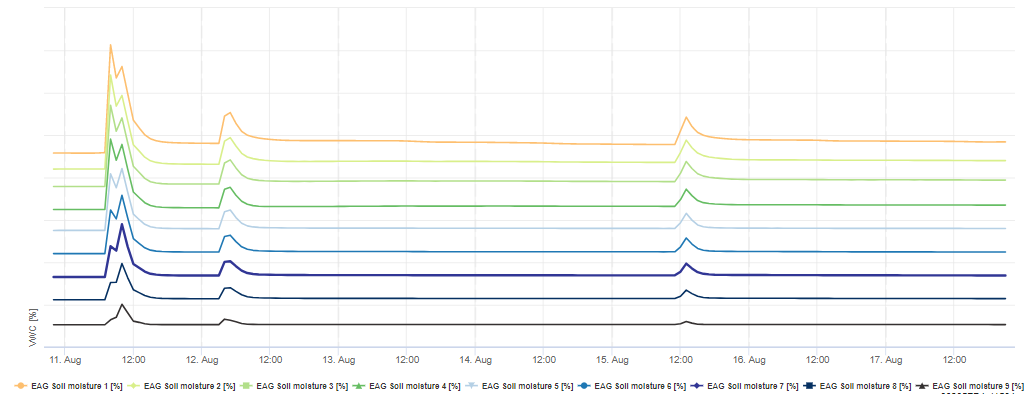
Figure 10. Moisture data on the vertical profile show overirrigation.
Literature:
[1] R. Sui et al., “Irrigation Scheduling Using Soil Moisture Sensors”, Journal of Agricultural Science; Vol. 10, No. 1; 2018
[2] B. Coblentz, “Moisture sensors help end soybean irrigation”, 2016
[3] Case Study: Iowa Corn 201
[4] S. Miller and Y. Dong, “Using soil moisture meters to complement irrigation scheduling”, 2019
[5] Sentek Technology, case studies
The Turning Information Into Profit: Ag Innovation Under the METOS Brand series is brought to you by Pessl Instruments.
For more than 35 years, Pessl Instruments has been offering tools for informed decision-making. A complete range of wireless, solar-powered monitoring systems under the iMETOS®️ brand, and FieldClimate platform provides remote field and weather monitoring data for farmers in all climate zones.

