
Most farmers think of aerial imagery as a scouting tool. Brian Sutton agrees it is great for scouting, but says farmers really see an ROI with the technology when they use it to create planting and fertilizing prescriptions.
Sutton is a no-tiller and pilot based in Lowell, Ind., who founded AirScout and its proprietary Thermal Imagery. Using an infrared thermal camera that captures three-one-hundredths of a Celsius degree, AirScout takes photos of fields throughout the season to create prescription planting and fertilizer maps based on 6-inch pixels.
At the 2026 National No-Tillage Conference in St. Louis, Sutton explained how the technology works and can be used to drive in-season nitrogen (N) management decisions.
Skip SSURGO, Capture Bare Soil
Many prescription maps are built on maps from the Soil Survey Geographic Database (SSURGO). Sutton calls this, “The biggest detriment to precision agriculture that will ever exist.”
The reason is due to a lack of consistency in how the maps were made, illustrated by Figure 1. Despite following the same instructions from the Univ. of Iowa, the three surveys conducted at the same location resulted in very different soil maps.
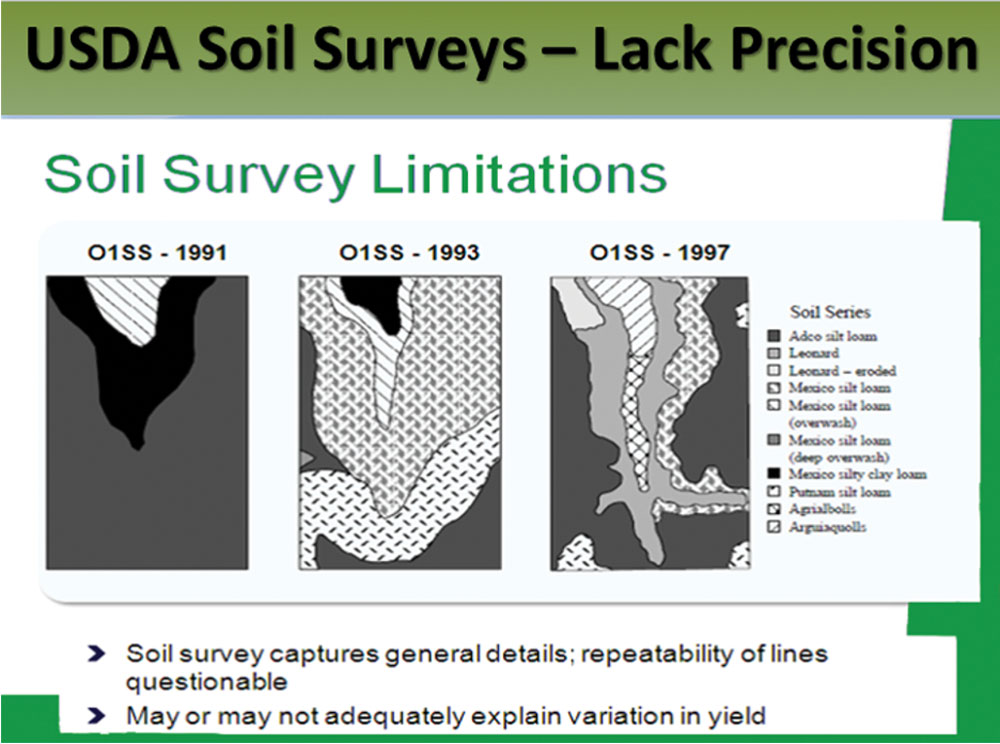
FIGURE 1. SURVEY INCONSISTENCIES. An experiment by the Univ. of Iowa had different groups of people map the same ground in three separate years. Despite following the same instructions, the survey takers all came up with very different maps. Univ. of Iowa
“SSURGO was never meant for precision ag,” Sutton says. “It had an entirely different purpose and they never dreamed what we would be doing with it today.”
Instead, Sutton says the best map a farmer can use for prescription applications is based on a photo taken when the field is bare and dry. Figure 2 demonstrates why: All the darker areas are where the field has higher organic matter. It has higher organic matter because that’s where the field has historically produced more.
“I know what your yield map is going to look like back in June or July…”
“This is like a 7,000-year yield map,” Sutton says. “I have thrown away every other layer I have ever had to build prescription maps and just go to this. I don’t care why it did it or how it did it. This is what it did for 7,000 years; there’s really good odds that it’s going to do it again next year.”
The important part about the bare soil image is ensuring the soil is dry, because wet soil looks like high organic matter. It’s why Sutton doesn’t recommend just pulling an image from Google Maps. He uses a thermal picture along with the bare soil photo to confirm it’s dry.
The bare soil photo is critical for N management, as it later helps farmers determine how much they should credit for mineralization.
Using Aerial Imagery to Spot the Season’s Trends
While the dry, bare soil photo is the most important aerial image to take, it’s just the starting point for in-season N management. Throughout the entire growing season, Sutton is capturing photos of growers’ fields every 7-10 days. By July, this gives the growers enough data to see how the season is progressing and help them determine what yields to shoot for, and therefore what their late-season N rates should be. It’s why Sutton calls AirScout’s N prescription program HindsightN.
“We need time to let the season play out so that we can play to the cards Mother Nature’s given us,” he says.
But of the images he’s capturing throughout the spring, the most important one is what Sutton calls the “fat kids” picture — the good, healthy, lush corn plants (Figure 2).
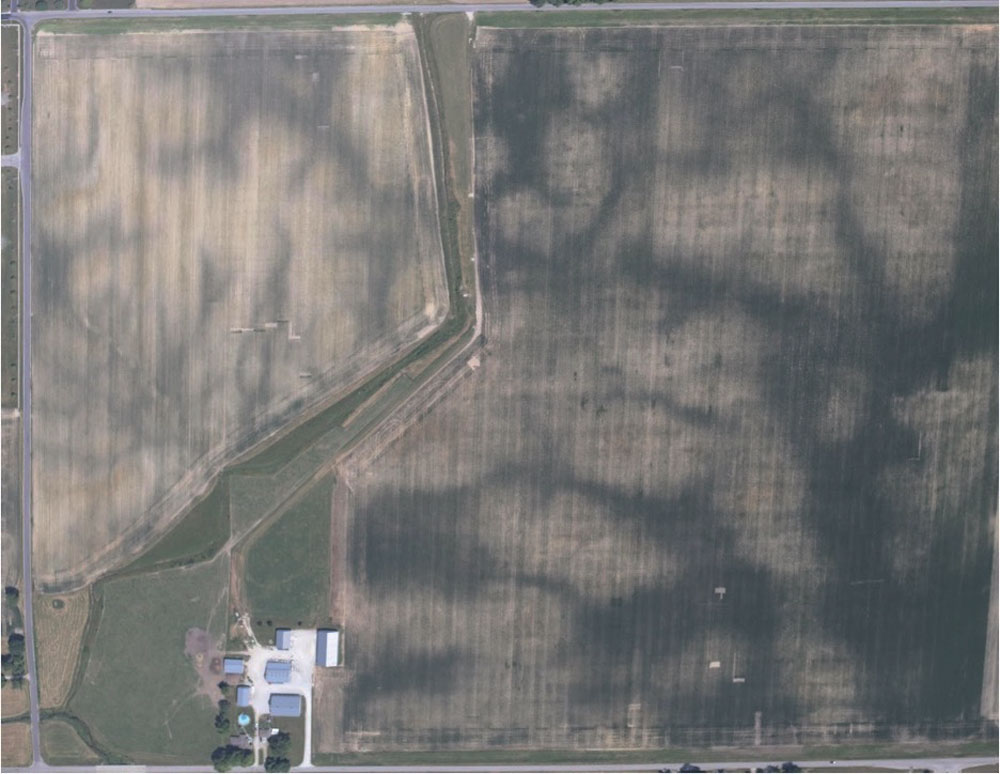
FIGURE 2. FINDING THE ‘FAT KIDS.’ Brian Sutton calls his healthy, lush, green corn plants his “fat kids” and says they show up in different places every year, usually due to rain events. Sutton says this field was planted with the same hybrid on the same day, so each plant had the same potential. Brian Sutton
The “fat kids” show up in different places every year, usually because of rain events. Sutton generally figures that 15% of a field is always good, 15% is always bad, and the other 70% floats from year to year.
“People think that their field is the same all the time,” he says. “It’s not. Only the bottom and the top ends are the same, and you’ve got a lot of it that’s floating back and forth. We need to identify those areas so we can adjust accordingly.”
HindsightN Qualifies for Indiana CSP
AirScout recently announced that the HindsightN program now qualifies as a practice under Indiana’s USDA Conservation Stewardship Program (CSP). Brian Sutton says the program will cover the cost of imagery, HindsightN prescription and late-season nitrogen application costs. AirScout is offering to help growers with their USDA applications. For more information, contact AirScout at www.airscout.com/contact.
The “fat kids” typically show up around V8, and capturing this photo is critical for building N prescriptions. If growers don’t get the photo in time, the field will be green and they won’t be able to identify the fat kids.
“I know what your yield map is going to look like back in June or July,” Sutton says. “I don’t necessarily know what the numbers are going to be, but I know what the map’s going to look like because it’s nearly impossible, from June 19 on, for the skinny kids to ever catch the fat kids.”
Creating Prescriptions by Yield, ‘N’ Mineralization
Once the “fat kids” photo has been captured, Sutton can combine it with the bare soil photo and use the two to create N prescriptions.
Creating those prescriptions in HindsightN starts by inputting the field’s highest and lowest organic matter percentages to create a range. The program defaults to a 20-pound N credit for each organic matter percent, but can be adjusted based on what the grower wants to credit for mineralization. Those credits are applied based on the bare soil photo.
“We need time to let the season play out so that we can play to the cards Mother Nature’s given us…”
Next, growers set their yield goals for the “fat kids” vs. the “skinny kids” and determine how much N they want to apply per bushel of their yield goal; the program defaults to 1 pound per bushel. Then it factors in what was previously applied, such as what was put down at planting, and any N credit growers want to take if the previous crop was soybeans or cover crops. It also factors in leaching, with a default 20% loss for N applied pre-season, 15% for at-plant and 10% for sidedress. But Sutton thinks the 20% loss rate for pre-season is a bit generous.
“With our warm, wet winters and these big heavy rains, the amount of nitrogen that doesn’t make it to the summer is probably closer to 40% or higher,” he says.
With all of the numbers considered, Hindsight N then determines N rates and calculates them based on the type of N the grower wants to use.
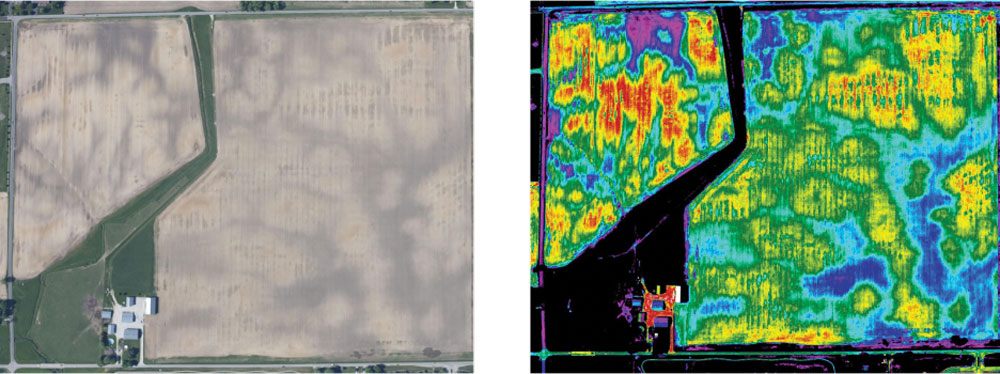
FIGURE 3. THE MOST IMPORTANT PICTURE. Capturing the field when it’s bare and the soil is dry (left) allows growers to see where the field is naturally higher in organic matter, which can help with calculating nitrogen mineralization, soil sampling and population prescriptions. The right photo shows how it converts to AirScout’s proprietary ADVI. Brian Sutton
“There’s no fancy algorithm,” Sutton says. “It just looked at your bare soil picture — did the math off of that; looked at your fat kid picture — did the math off of that; know what you blanket applied and spit this thing out.”
The zones are built on 6-inch pixels that use Sutton’s proprietary index imaging: Advanced Difference Vegetation Index (ADVI). Sutton created ADVI because Normalized Difference Vegetation Index (NDVI) relies on vegetation chlorophyll, so it doesn’t work on bare soil. ADVI also allows AirScout to amplify shades of green and brown, and apply numbers to the pixels to build prescriptions. Once the zones are built, the map can be downloaded into a shape file that will work with any variable-rate controller.
Using Hindsight for Better Forecasting
With the zones built to cater to the “fat kids,” growers can tailor their in-season N applications to chase higher yield when and where it matters.
No-tiller Mike Starkey has tested this on his farm in Brownsburg, Ind. He conducted strip trials where he would make just one N application at V4 or V6 using Y-Drops vs. making one at V4-V6 and a second at VT.
“The yield difference for that second application is the golden carrot that I’m looking for, because we have such racehorse hybrids that can produce 300-bushel corn, they like this nitrogen on the back end,” he says. “We need to spoon-feed these hybrids to get the maximum yield potential for them, put on N as it’s needed.”
Why Prescriptions Need Planes
Brian Sutton is often asked if farmers can use satellites or drones to capture these images instead of hiring a plane. The answer is no.
Satellite imagery can’t be relied upon because of the potential for clouds, especially when capturing the “fat kids” photo. Since the window to take the “fat kids” picture is only 7-10 days, the risk is too high that the satellite won’t capture it if there’s clouds during that time. “If I don’t get the fat kid picture, this whole thing falls apart,” he says.
Drones also don’t work because they can’t capture the field in one shot. The reason that’s important is because of the high resolution of the thermal camera. Since the camera detects temperature changes by three-one-hundredths of a Celsius degree, Sutton says he can’t take two pictures in a row without the entire field changing by at least that amount.
By the time a drone can take enough photos to capture the whole field, the temperature may have changed significantly. Trying to blend all of the pictures together would lose the thermal resolution they need. Even if you could document the change in temperature over several images, Sutton believes it would be difficult to compare the pixels.
“There are just too many parameters going on with how the sun is heating the earth every millisecond, and how it’s doing that differently according to a fat kid area vs. a skinny kid area,” he says. “The only way I can actually compare the pixels and make them relative to each other is by knowing that it happened in that one instant in time.”
Since drones are limited to 400 feet, and Sutton flies at 5,000 feet, it’s not possible for a drone to capture that one snapshot required for the thermal imaging.
When Starkey makes that second application using the prescriptions from AirScout, he can see the rates correlate to where the corn is greener vs. where it’s lighter.
“I know I’m maximizing the amount of nitrogen that corn needs to get that 300-bushel yield, and when I get into that lighter corn, I’m only going to put it on when it’s needed.”
Sutton adds that this method of waiting to see how the season goes not only ensures the healthy corn plants are fed enough N and it’s going where it matters most, but it can save growers N dollars if the season is a bust. Sutton says there have been times they prevent plant, and because they use this method instead of making any pre-season applications, they’re not losing any money from wasted N.
“You guys know how crop insurance works,” he says. “You get done at the end of the year and you turn that claim in — they don’t ask how much you put into it. That’s not part of the equation. The less you put in, the bigger the difference; all of a sudden you can actually make money in a prevent-plant year.”
Using Imagery Beyond Nitrogen
While farmers can see an ROI from using aerial imagery for in-season N management, the technology can also be used for other important purposes. The bare soil photo in particular can be used to guide planting populations based on where soil organic matter is higher and lower, as well as soil sampling.
“It gets back to, why did it grow more stuff?” Sutton says. “What do we need to do in those places? Then as we transition to other zones that can’t support those yields, why can’t they?”
Sutton can attest first-hand to how imaging has influenced changes on his own farm.
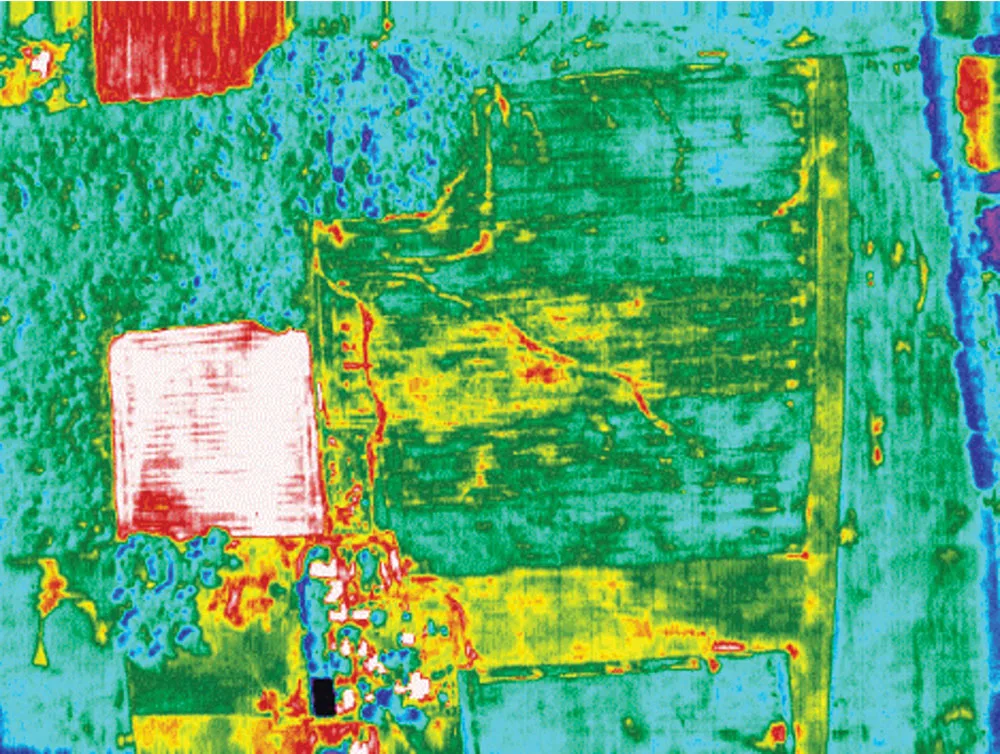
Sutton and his brother, Dan, no-till 1,500 acres in northwest Indiana. Most of it is corn and soybeans, but they also raise some alfalfa for their 120-head of beef cattle. One of the first times Sutton used the thermal camera on one of their soybean fields, he noticed a difference in the middle of the field (Figure 4). Dan had planted the field, and when Sutton asked why that area was different, Dan realized that was where they had put up temporary fencing to pasture cows on the cornstalks in the fall. Sutton then consulted agronomist Ken Ferrie about the thermal image, who suggested the soybeans were showing drought stress caused by soil compaction.
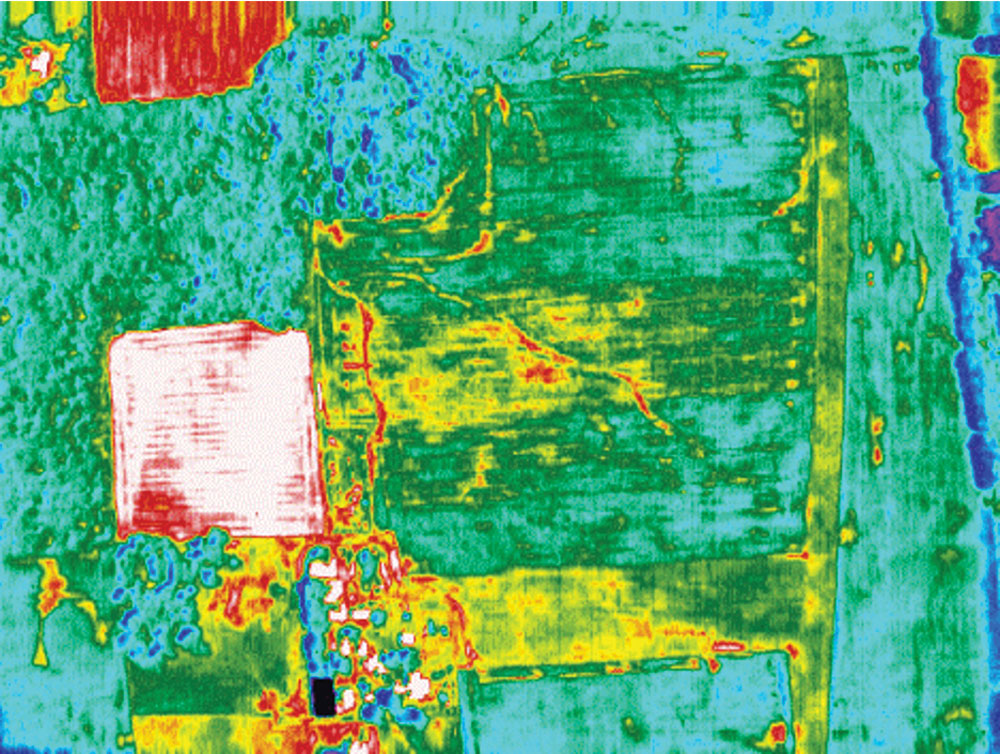
FIGURE 4. VISUALIZING COW COMPACTION. Thermal imaging helped Brian and Dan Sutton see that where they had grazed their cows on cornstalks the previous fall was showing up in the following soybean crop. The center area that is yellow and red experienced a 7-bushel yield hit compared to the rest of the field. Brian Sutton
After harvest, Sutton looked to see what the yield hit was for those soybeans and found it was about 7 bushels per acre.
“That’s really expensive cow feed,” he says. “We’ve been pasturing cows on cornstalks since the Civil War, so this was the first time the imagery now changed the way we farm.”

![[Technology Corner] Aligning ‘Smart Implements’ with Autonomous Tractors](https://www.precisionfarmingdealer.com/ext/resources/2026/10/01/Aligning-Smart-Implements-with-Autonomous-Tractors.webp?height=290&t=1790966217&width=400)

